Idaho Hunt Planner We got game.
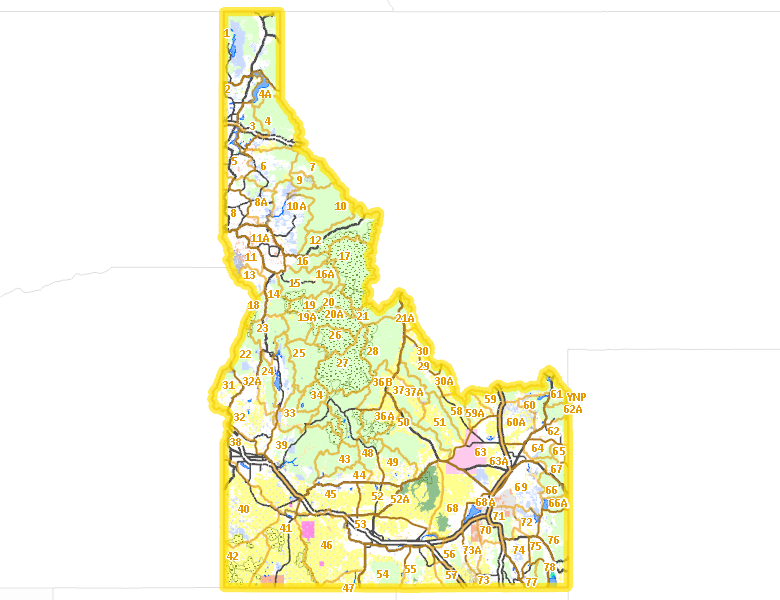
Sorry, unit was not found. You may click on the map of Idaho below to open an interactive map viewer or return to the homepage.
Public Access
Surface Management
For government land, these data show the managing agency of the land, which may or not be the same as the owning agency.
| U.S. Forest Service (USFS) |  37.94
%
37.94
%
|
| Private |
29.7
%
|
| U.S. Bureau of Land Management (BLM) |
21.88
%
|
| State of Idaho |
4.58
%
|
| U.S. Department of Energy (DOE) |
1.05
%
|
| U.S. National Park Service (NPS) |
0.96
%
|
| Indian Reservation / Bureau of Indian Affairs |
0.88
%
|
| Indian Reservation / Bureau of Indian Affairs |
0.87
%
|
| Other |
0.58
%
|
| State of Idaho |
0.41
%
|
| U.S. Bureau of Reclamation (BOR) |
0.37
%
|
| U.S. Military |
0.24
%
|
| U.S. Department of Interior (DOI) |
0.13
%
|
| U.S. Department of Agriculture (USDA) |
0.09
%
|
| State of Idaho |
0.08
%
|
| Other |
0.05
%
|
| U.S. Corps of Engineers (COE) |
0.05
%
|
| U.S. National Wildlife Refuge (NWR) |
0.04
%
|
Make your own map of
Ownership data source: Inside Idaho
Access Yes! Properties
- Mica Creek Drainage on St. Joe River
- Hugas Creek & St. Joe River Basin
- Paddock Valley Reservoir
- Sturgill Creek
- Letha - Payette River Access
- Rinker Rock Creek Ranch
- Fox Hills Ranch
- Windy Wheat, LLC
- Little Fish Creek Grazing Assoc.
- Telfer Inc.
- Steve Deeg Farms
- Robert Gardner
- Pleasant Valley Grazing Association
- Bob Ivie Property
- Rockland Valley - West
- Janss Farms
National Forests
- Bitterroot National Forest
- Boise National Forest
- Caribou National Forest
- Clearwater National Forest
- Coeur d'Alene National Forest
- Kaniksu National Forest
- Kootenai National Forest
- Nezperce National Forest
- Payette National Forest
- Sawtooth National Forest
- St. Joe National Forest
- Targhee National Forest
- Salmon-Challis National Forest
Federally-designated Wilderness Areas
No motorized vehicles are allowed in these areas.
-
Frank Church - River of No Return Wilderness
2,357,999 acres (4.41% of hunt area) -
Selway Bitterroot Wilderness
1,092,240 acres (2.04% of hunt area) -
Owyhee River Wilderness
272,397 acres (0.51% of hunt area) -
Sawtooth Wilderness
217,590 acres (0.41% of hunt area) -
Gospel Hump Wilderness
205,589 acres (0.38% of hunt area) -
Bruneau-Jarbridge Rivers Wilderness
94,853 acres (0.18% of hunt area) -
Hells Canyon Wilderness
86,379 acres (0.16% of hunt area) -
Big Jacks Creek Wilderness
56,546 acres (0.11% of hunt area) -
Little Jacks Creek Wilderness
54,935 acres (0.1% of hunt area) -
North Fork Owyhee Wilderness
44,684 acres (0.08% of hunt area) -
Pole Creek Wilderness
13,405 acres (0.03% of hunt area)
Land Use/Cover
| Forest |
40.39
%
|
| Rangeland |
38.06
%
|
| Dryland Agriculture |
8.17
%
|
| Irrigated-Gravity Flow |
5.29
%
|
| Irrigated-Sprinkler |
4.61
%
|
| Riparian |
1.12
%
|
| Rock |
1.05
%
|
| Water |
0.71
%
|
| Urban |
0.58
%
|
Make your own map of
Land Use data source: IDWR